How Return Rates Destroy Ecommerce Profit Margins (And What to Do About It)

Most ecommerce sellers focus obsessively on their gross margin — the spread between what they paid for a product and what they sold it for. What they rarely calculate is what happens to that margin when 10%, 15%, or 25% of their orders come back. Returns are not a customer service problem. They are a profit problem, and for many product categories, they are the single largest unaccounted cost in the business.
This guide breaks down the true cost of ecommerce returns, provides category benchmarks, and shows you exactly how to calculate the return-adjusted margin on any product before you order inventory.
The True Cost of a Single Return
When a customer returns a product, the visible cost is the refund. The invisible costs are what kill margins. A complete accounting of a single return includes: the original outbound shipping cost (which you rarely recover), the return shipping label cost (which you often pay), the labor cost to receive and inspect the item, restocking or repackaging costs if the item can be resold, and the loss on items that cannot be resold at full price due to opened packaging or cosmetic damage.
For a product that sells for $35 with a $10 landed cost and a $7 gross profit, a single return might cost $12-18 in total when all direct and indirect costs are accounted for. That means one return wipes out the profit from two successful sales. At a 15% return rate, you need to sell 1.3 units for every unit you actually keep in a customer's hands.
The formula for return-adjusted net margin is: (Gross Margin per Unit x Sell-Through Rate) minus (Return Cost per Unit x Return Rate) divided by Revenue per Unit. Running this calculation before sourcing a product gives you a far more accurate picture of true profitability than gross margin alone.
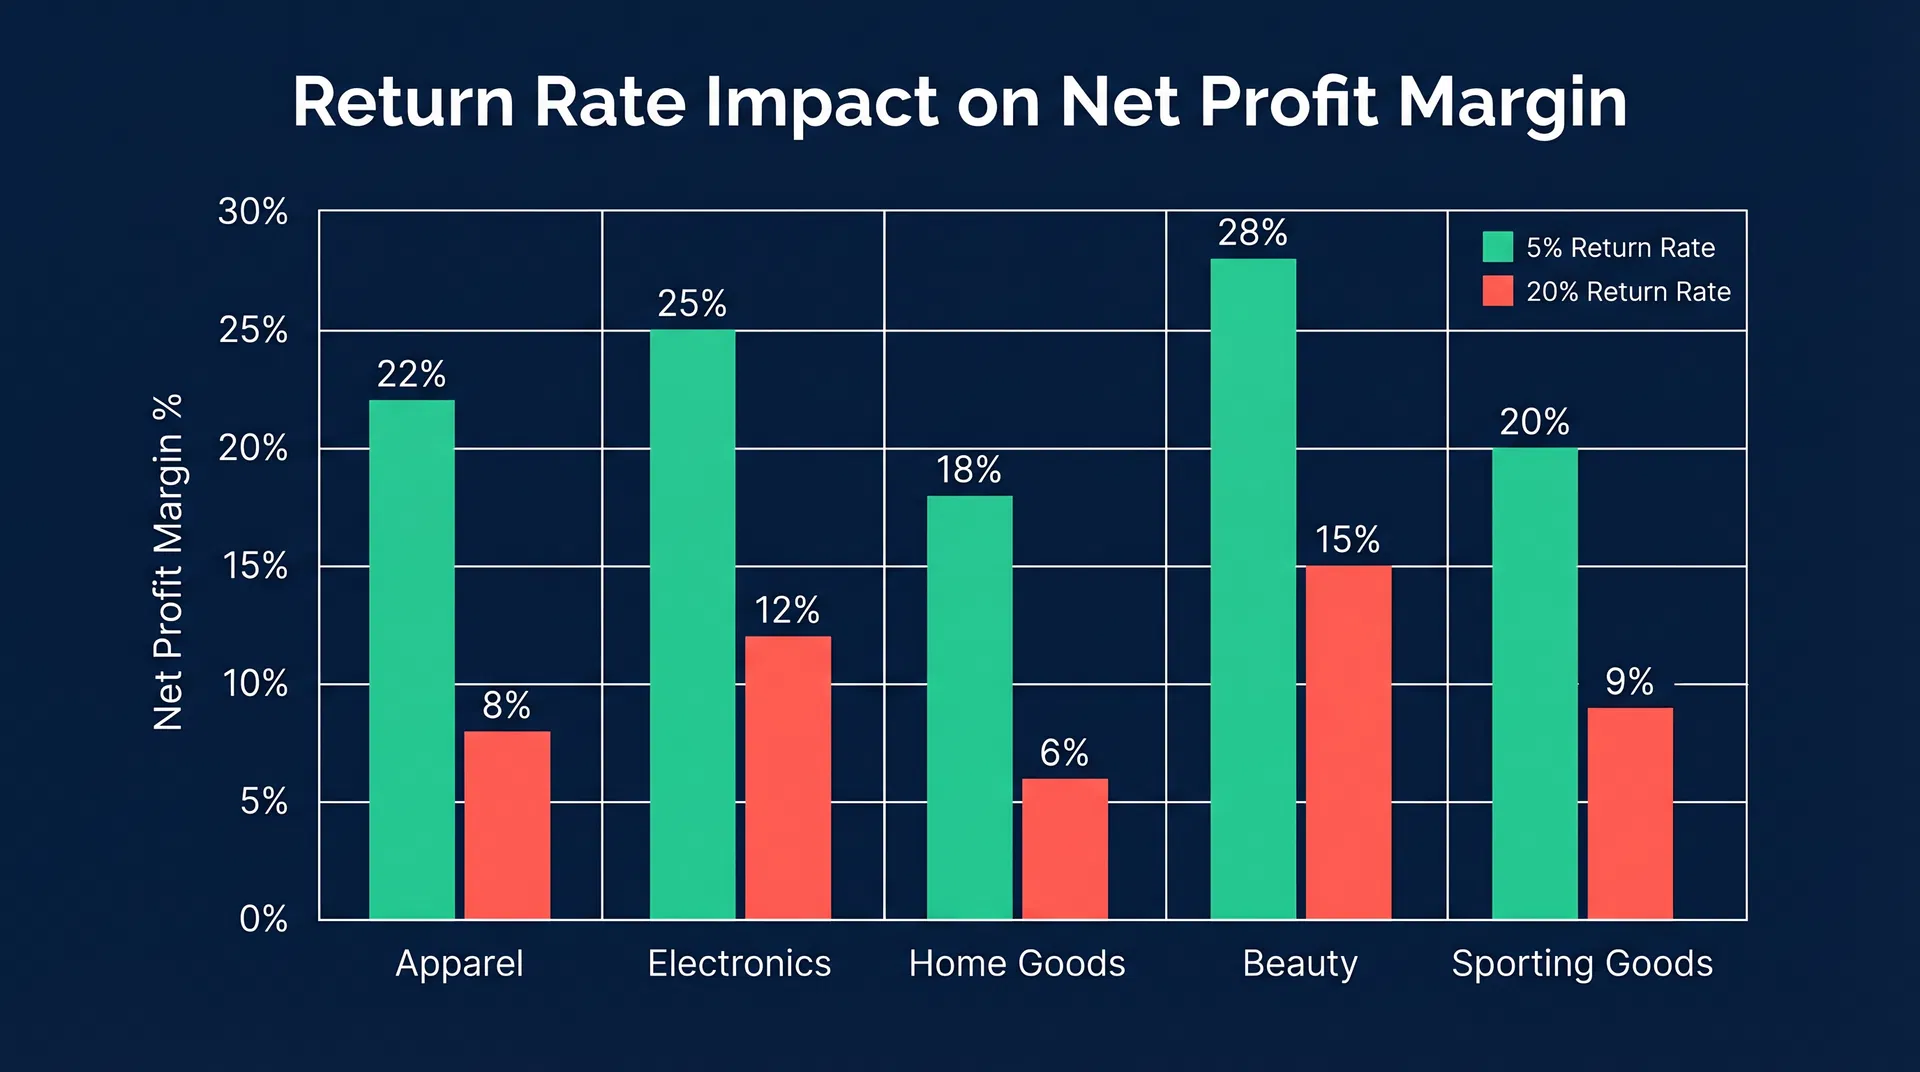
Return Rate Benchmarks by Product Category
Return rates vary enormously by product category, and understanding where your category falls is the starting point for building a realistic margin model. Apparel and footwear have the highest return rates in ecommerce, averaging 20-35% across the industry. Sizing issues, color discrepancies between photos and reality, and fit uncertainty drive the majority of these returns. Electronics accessories run 10-18% due to compatibility issues and buyer's remorse on impulse purchases. Home goods and furniture average 8-12%, with returns concentrated in items where dimensions or color were misrepresented in listings.
Beauty and skincare products have some of the lowest return rates, typically 3-8%, because customers are less likely to return consumable products and because beauty purchases are often repeat buys from trusted brands. Sporting goods and outdoor equipment run 6-10%, with returns concentrated in items that require fit or sizing (shoes, wetsuits, helmets) rather than hard goods.
| Category | Avg Return Rate | Primary Return Driver |
|---|---|---|
| Apparel & Footwear | 20–35% | Sizing, fit, color mismatch |
| Electronics Accessories | 10–18% | Compatibility, buyer's remorse |
| Home Goods & Furniture | 8–12% | Size/color mismatch |
| Toys & Games | 5–10% | Defects, not as described |
| Sporting Goods | 6–10% | Fit issues, performance |
| Health & Beauty | 3–8% | Low — consumable product |
| Pet Supplies | 4–7% | Low — emotional purchase |
How Returns Compound with Platform Fees
On Amazon, returns are particularly damaging because Amazon charges a returns processing fee on certain categories, and the seller often eats the outbound fulfillment fee even on returned orders. For an FBA seller with a 15% return rate, the effective fulfillment cost per sold unit is not the standard FBA fee — it is the FBA fee plus 15% of the return processing cost plus 15% of the outbound fee on returned orders. This can add $0.50-2.00 to the effective fulfillment cost per unit depending on product size and category.
On Shopify, the return cost structure is different but equally punishing. Sellers typically absorb the return shipping label cost, which runs $4-8 for standard parcels. At a 15% return rate on a product with 100 monthly orders, that is $60-120 in return shipping costs alone — before accounting for restocking labor or unsellable inventory write-offs.
Strategies to Reduce Return Rates Without Reducing Sales
The most effective return reduction strategies address the root cause of returns rather than making returns harder. Sizing guides with precise measurements (not just S/M/L) reduce apparel returns by 20-30% for sellers who implement them correctly. Video demonstrations showing actual product dimensions reduce home goods returns by helping customers accurately visualize scale. Compatibility checkers for electronics accessories — simple dropdowns that confirm a product works with a customer's specific device — can cut compatibility-related returns nearly to zero.
Proactive customer communication after purchase also reduces returns. A post-purchase email with setup instructions, usage tips, and a direct customer service contact reduces returns from "I couldn't figure it out" situations. For products with a learning curve, a short video tutorial linked in the confirmation email can meaningfully improve customer satisfaction and reduce return rates.
Return policy design matters too. Counterintuitively, extending your return window often reduces the actual return rate. Customers who feel less time pressure to make a return decision often keep products longer, become more attached to them, and ultimately decide not to return. A 60-day window typically generates fewer returns than a 30-day window for most product categories.
Building Return Costs Into Your Margin Model
The correct approach is to treat your expected return rate as a cost input, not an afterthought. Before sourcing any product, estimate the return rate based on category benchmarks and your specific product type. Calculate the total cost per return including shipping, processing, and restocking. Multiply by your expected return rate to get the return cost per unit sold. Add this to your COGS before calculating margin.
A product with a 25% gross margin that has a 20% return rate and $12 total return cost per return on a $40 sale price has an effective return cost of $2.40 per unit sold. That reduces the effective gross margin from 25% to 19%. At scale, that 6-point margin difference is the difference between a profitable product line and a money-losing one.
Put these numbers to work
Run a real product analysis with landed cost, tariffs, and all fees calculated automatically.
Related Articles