Amazon PPC Profitability: How to Calculate Your True ACoS Break-Even

Amazon PPC advertising can be the engine that drives your product to page one, or the leak that quietly drains every dollar of margin you worked to build. The difference comes down to one number: your Advertising Cost of Sale, or ACoS. Understanding exactly how ACoS interacts with your gross margin is the most important calculation any Amazon seller can do before spending a single dollar on ads.
What Is ACoS and Why Does It Matter?
ACoS is the percentage of attributed sales revenue that you spent on advertising. If you spend $20 in ads to generate $100 in sales, your ACoS is 20%. Amazon reports this figure inside Seller Central for every campaign, ad group, and keyword. The problem is that Amazon presents ACoS in isolation, without showing you what it means for your actual profit. A 20% ACoS sounds reasonable until you realize your gross margin is only 22%, leaving you with a 2% net margin before any other operating costs.
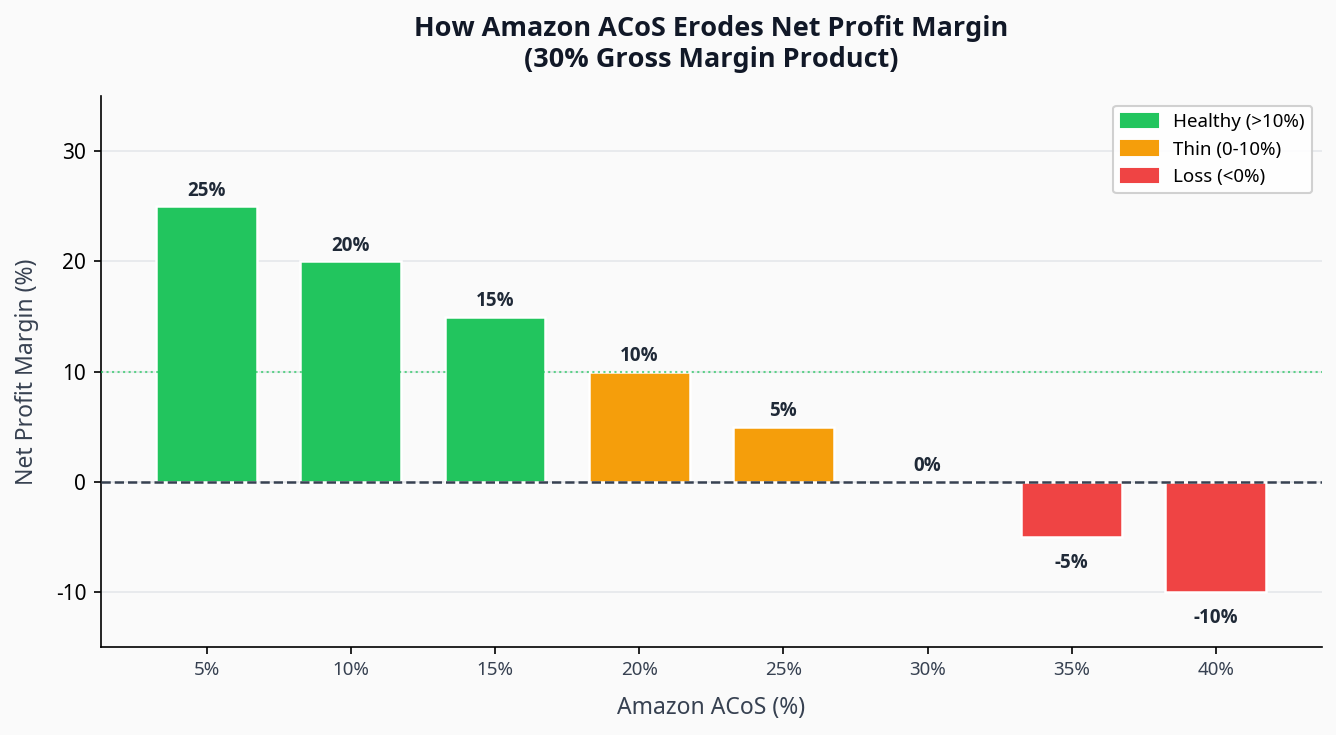
The formula that matters is simple: Net Margin = Gross Margin % - ACoS %. Every percentage point of ACoS you spend above your gross margin is a percentage point of loss. Every point you spend below it is profit. This is why sellers with thin margins get destroyed by the same ACoS that barely affects a seller with a 40% gross margin.
The Break-Even ACoS Calculation
Your break-even ACoS is the maximum you can spend on ads before your net margin hits zero. It equals your gross margin percentage. If your product costs $8 landed and sells for $25 on Amazon, your gross margin before fees is 68%. After Amazon's referral fee (typically 15%) and FBA fees (roughly $4.50 for a standard item), your net gross margin before ads might be around 28-30%. That 28-30% is your break-even ACoS ceiling.
Most experienced sellers target an ACoS that is 5 to 10 percentage points below break-even, leaving room for a real profit margin. If your break-even ACoS is 28%, a target ACoS of 18-22% gives you a 6-10% net margin after advertising, which is a sustainable business.
Why Most Sellers Misread Their ACoS
The most common mistake is comparing ACoS to revenue rather than to gross margin. A seller sees a 25% ACoS and thinks it is acceptable because they have heard that anything under 30% is fine. But that benchmark is meaningless without knowing the margin. A 25% ACoS on a product with a 22% gross margin means you are losing 3 cents on every dollar of PPC-driven revenue. Do enough volume and you will lose money faster as you scale.
The second mistake is ignoring the halo effect. PPC ads drive organic rank, which generates organic sales that carry no ad cost. Sellers who track only PPC-attributed sales underestimate the full return on their ad spend. A more complete metric is Total ACoS (TACoS), which divides total ad spend by total revenue (PPC plus organic). A product with a 30% ACoS but a 12% TACoS is actually performing well because the ads are building organic velocity.
ACoS Benchmarks by Product Category
ACoS varies significantly by category because competition, conversion rates, and average order values differ. The table below shows typical ACoS ranges for common Amazon categories based on aggregated seller data.
| Category | Typical ACoS Range | Notes |
|---|---|---|
| Beauty & Personal Care | 18-35% | High repeat purchase rate helps TACoS |
| Home & Kitchen | 20-40% | Broad competition; keyword costs vary widely |
| Sports & Outdoors | 15-30% | Seasonal spikes affect averages |
| Toys & Games | 25-45% | Holiday concentration drives up CPCs |
| Health & Household | 18-32% | Consumables benefit from Subscribe & Save |
| Pet Supplies | 20-38% | Strong brand loyalty once established |
| Electronics Accessories | 22-42% | High CPC due to brand competition |
How to Reduce ACoS Without Cutting Ad Spend
Reducing ACoS is not simply about spending less. Cutting budget indiscriminately will collapse your organic rank along with your ad spend. The goal is to improve the efficiency of every dollar you do spend.
The most impactful lever is keyword harvesting. Move converting search terms from auto campaigns into manual exact-match campaigns where you can control bids precisely. Negate irrelevant terms aggressively. A product selling kitchen knives should not be appearing for searches like "knife sharpener" unless that keyword converts at your target ACoS.
The second lever is your product listing quality. ACoS is a function of conversion rate as much as it is a function of bid price. A listing with poor images, weak bullet points, and no A+ content will convert at 8-12%. The same product with professional photography and a well-structured listing might convert at 18-22%. That conversion rate improvement cuts your effective ACoS nearly in half without touching your bids.
The third lever is price. A higher price with the same conversion rate and the same ad spend produces a lower ACoS because the denominator (revenue) is larger. This is why premium positioning is not just a branding strategy; it is a profitability strategy.
The Relationship Between ACoS and Product Launch Strategy
During a product launch, most sellers accept a high ACoS intentionally. The goal is not immediate profitability but rank acquisition. Running at 60-80% ACoS for the first 30-60 days to build velocity and reviews is a legitimate strategy, provided you have modeled the total cash outlay and have the capital to sustain it. The mistake is treating launch ACoS as permanent and never transitioning to a profitability-focused campaign structure once rank is established.
A disciplined launch plan sets a specific timeline and ACoS target for each phase. Phase one might be 60% ACoS for 30 days to get to page one. Phase two drops to 35% ACoS for 30 days to consolidate rank. Phase three targets 20% ACoS for ongoing profitability. Without this structure, sellers stay in perpetual launch mode and wonder why their profitable-looking product never generates cash.
Key Takeaways
ACoS is only meaningful in the context of your gross margin. Your break-even ACoS equals your gross margin percentage after Amazon fees. Target an ACoS 5-10 points below break-even to generate a real net margin. Improve conversion rate and listing quality to reduce ACoS without cutting spend. Use TACoS rather than ACoS to evaluate campaigns that are building organic rank. And model every scenario in a profit calculator before committing budget to a new product or campaign.
Calculate Your Break-Even ACoS
Enter your product costs and Amazon fees into ProfitBeacon to see your exact break-even ACoS and target margin in seconds.
Open the Profit Calculator →Related Reading
Put these numbers to work
Run a real product analysis with landed cost, tariffs, and all fees calculated automatically.
Related Articles